Trading strategies in both traditional and crypto markets have a wide range of tools to understand whether it is a good moment to invest or not in a specific asset or digital currency. However, not all of the traders use the same tools when they are trading digital assets.
When having a look at the charts, it is certainly helpful to have several technical analysis tools that would allow you to understand where the market is moving. Although these tools do not provide 100% predictability, they can be very useful in many situations.
There are several indicators for traders and each of them would provide users with different tools to be able to trade cryptocurrencies and other assets. In this article, we will share with you some of the most popular trading indicators among traders.
Disclaimer: All the information provided by AltSignals and its writers shouldn’t be taken as financial advice. The article has been created for educational purposes. Never invest more than what you are able to lose and only ask for advice to your personal financial advisor.
Indicator 1 – Moving Average
This is one of the most popular indicators for users that are investing in digital assets. The moving average, as the name suggests, provides users with an average price during a specific period of time.
There are different MA that can measure days, weeks or even months. Usually, they are used to understand which is the general trend of the market. Usually, they are not used to predict future price movements but they can be used with the price of an asset on a daily or weekly basis.
If for example, the price of an asset moves above or below an important MA, we could be changing the trend into upward movements or downward trends.
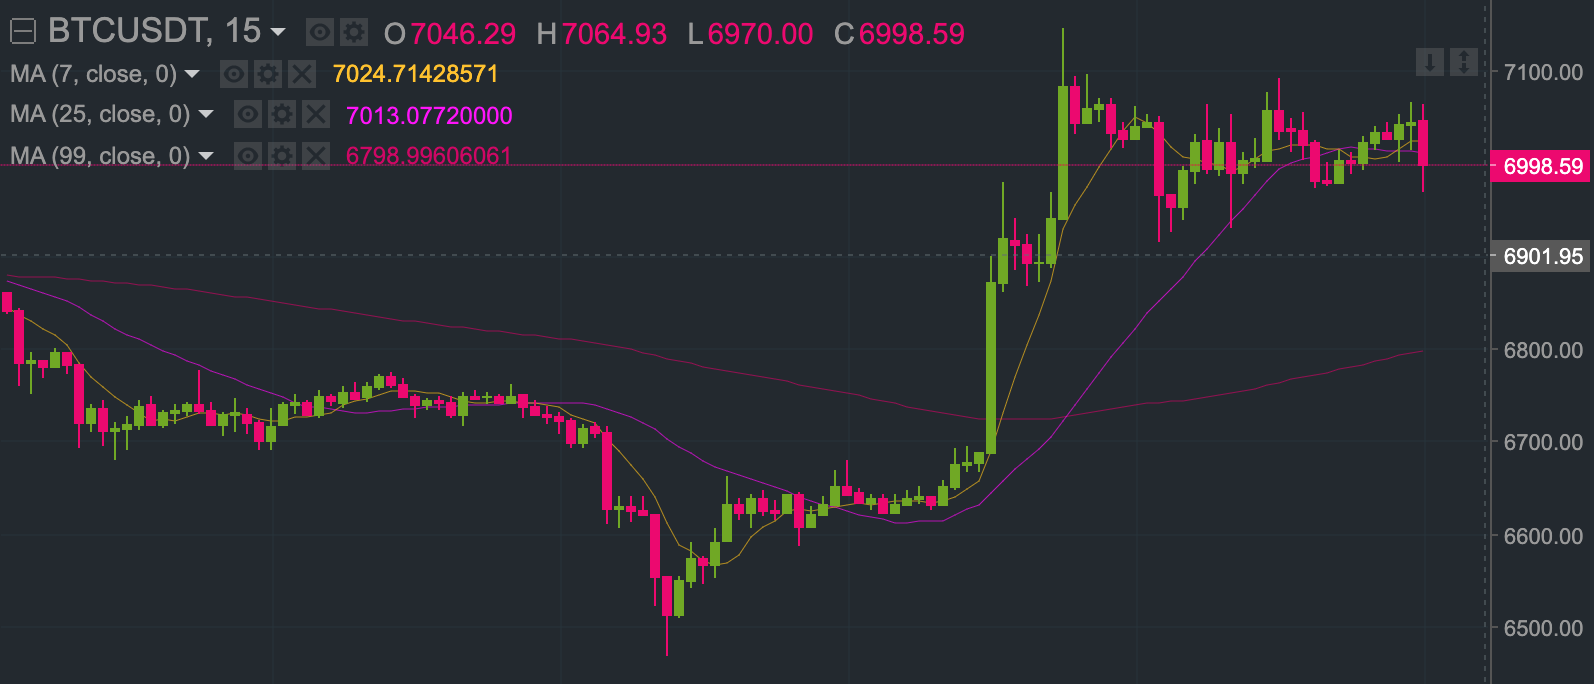
Indicator 2 – MACD
MACD stands for Moving Average Convergence Divergence and it works as an indicator that allows users to understand whether there is a bullish or bearish trend in the market. This is certainly important considering that if we are able to find a trend then we will be able to trade in the current trend before it changes its path.
The MACD is also useful for traders to find support and resistance levels and identify whether it is a good moment to enter or exit a trade. The MACD is the combination of two other indicators, the EMA 12 and EMA 26. Specifically, the MACD can be calculated by subtracting the 26-EMA from the 12-EMA.


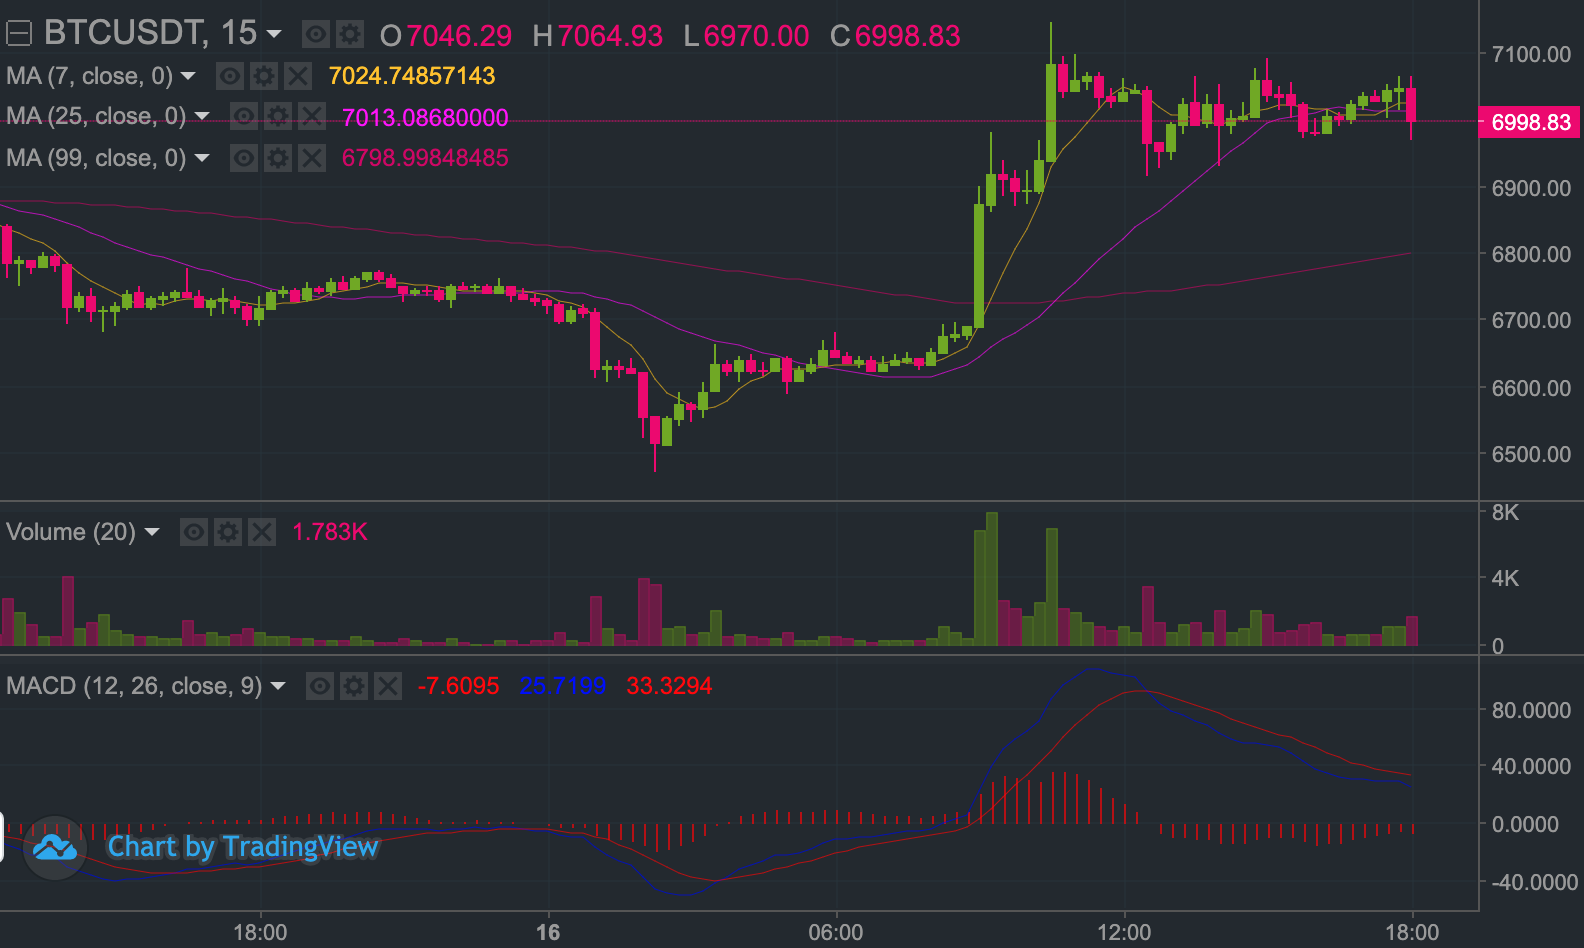
Indicator 3 – Exponential Moving Average
The Exponential Moving Average (EMA) works in a similar way to traditional or simple moving averages such as the once mentioned before. This indicator is great to increase the weight of recent observations when building a trend line.
This is good to understand how recent data points can influence trends and movements in the market. In general, traders use the 12 and 26-day EMAs in order to apply short-term strategies. However, if they want to trade long-term trends, they should use 50 and 200-day EMAs.
Indicator 4 – Fibonacci Retracement
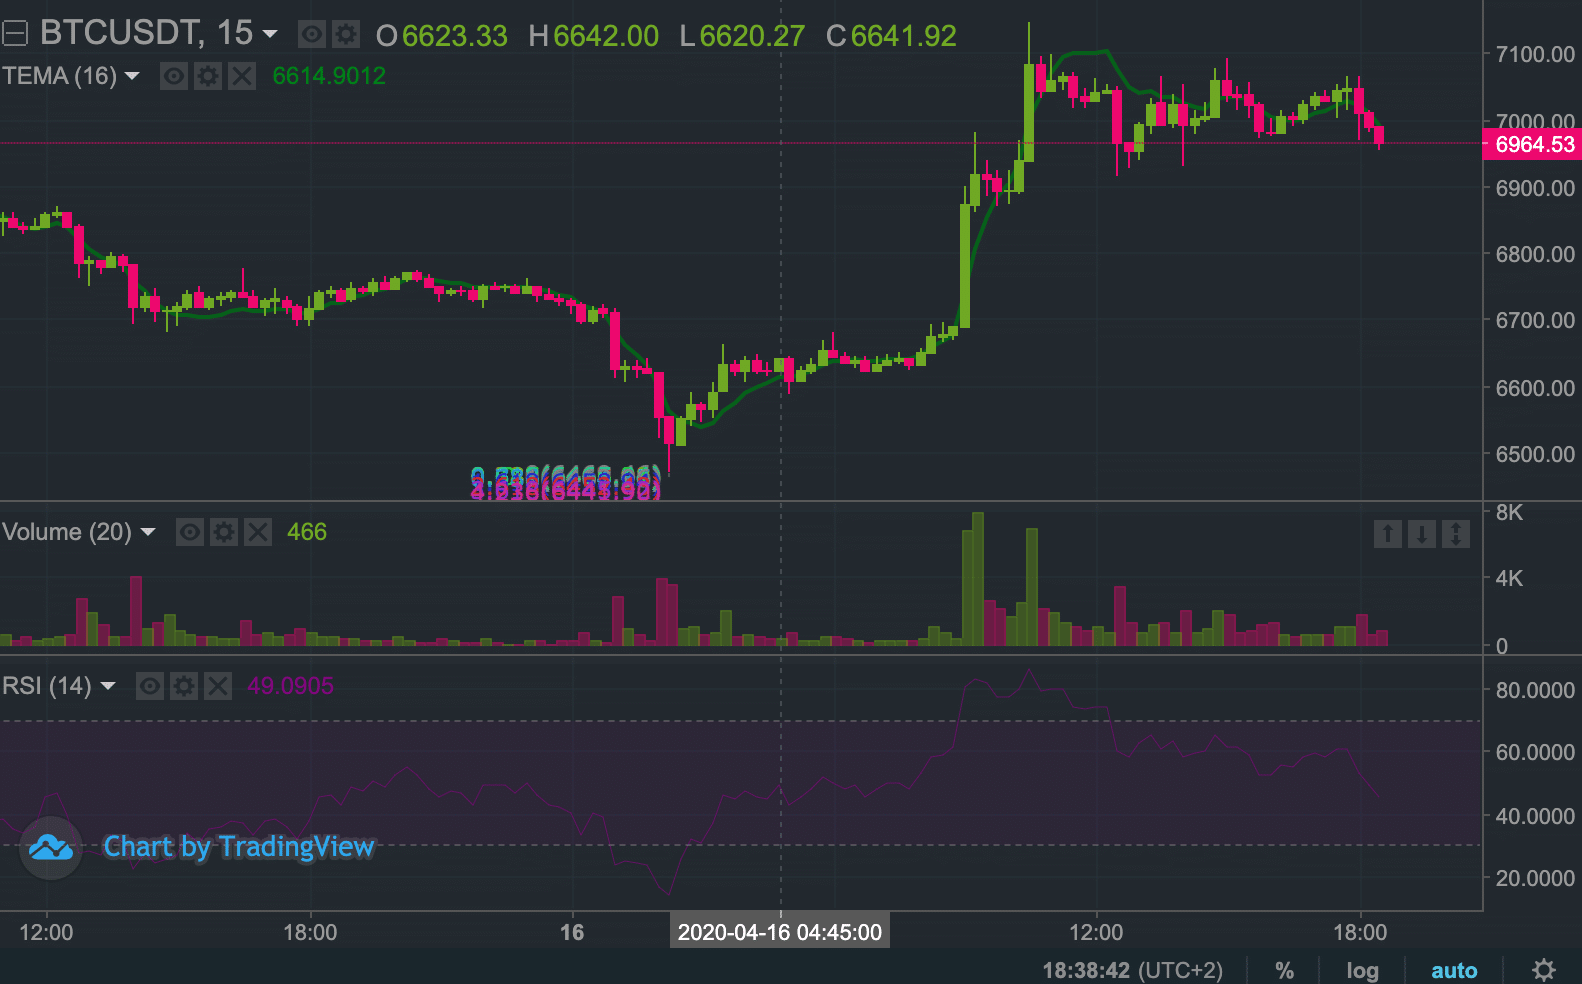
Fibonacci retracement is one of the most useful tools for traders in any market. They can be very useful to predict the retracement or advancement of a specific cryptocurrency or asset. The tool can be very useful in order to understand and identify support and resistance levels.
The Fibonacci tool can be used with other trading indicators that would be great for traders to be prepared for price movements and the reach of these fluctuations.
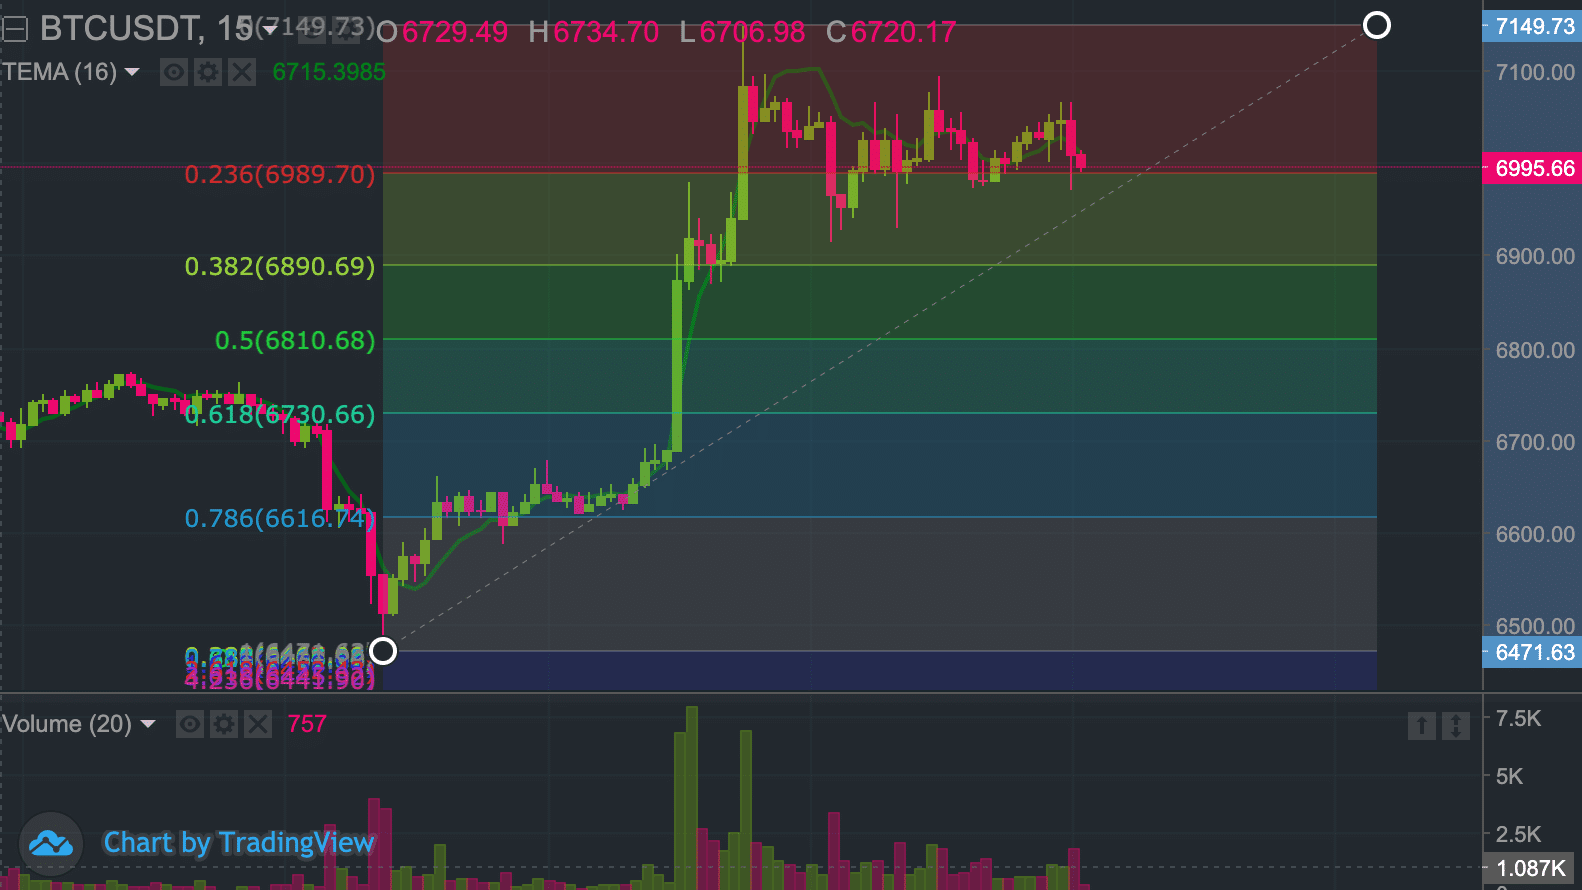
In the image above, you can see the 0.786, the 0.382 and the 0.236 levels are playing important roles in showing resistance and support levels. Moreover, used with Elliot Waves, this tool can be very useful for traders.
Indicator 5 – Relative Strength Index
The Relative Strength Index (RSI) can be used by traders to understand momentum in the market. The RSI ranges between 0 and 100 and it shows three main ranges. When the indicator fluctuates between 70 and 100, an asset price would be in “overbought” territory. If the indicator ranges between 0 and 30, the asset would be in an “oversold” condition.
All the values in the middle of that range would be a normal price performance for an asset. In general, this can be used to see whether a price movement in the market is sustainable in the long term or it may experience a retracement or peak in the near future.