Top 4 Trading Indicators for Cryptocurrencies
There are different trading indicators for cryptocurrencies. We can use them to improve our trading strategies and performance while trading. These trading indicators for cryptocurrencies are going to be a guide you can use to trade. However, they are not going to be 100% accurate.
There are different trading indicators for cryptocurrencies. We can use them to improve our trading strategies and performance while trading. These trading indicators for cryptocurrencies are going to be a guide you can use to trade. However, they are not going to be 100% accurate.
That means that we can follow them as guides that would allow us to place our trades in the market. At the same time, you should combine these trading indicators with other valuable tools and information. In this way, you can be sure that you are analysing all different factors that could influence the price of virtual currencies.
Disclaimer: this post should not be considered investment advice. This is only for educational purposes only. Never invest more than what you are able to lose and always ask for information to your professional financial advisors. We are not financial advisors.
Top 4 Trading Indicators for Cryptocurrencies
Without further ado, let’s get into the article.
Fibonacci Retracement Levels
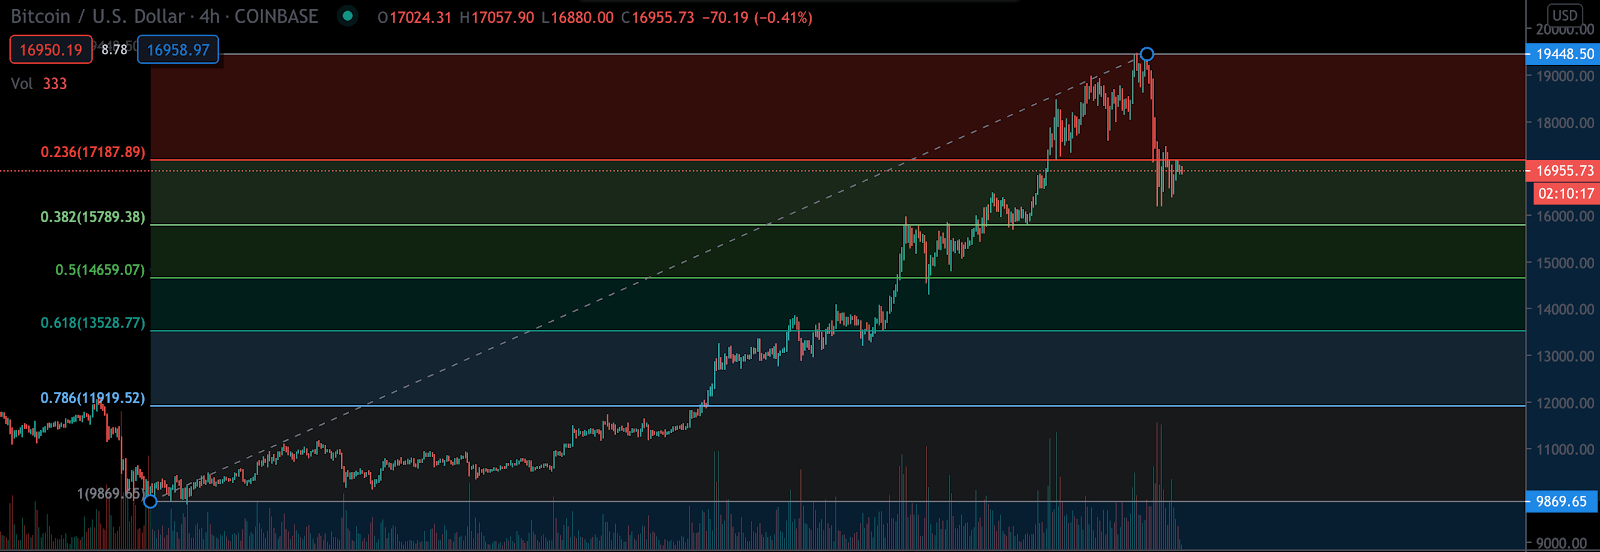
Support and resistance levels are very important to understand whether the price of a cryptocurrency could make a pause. Resistance levels would make it difficult for the price of an asset to move higher. Support levels would help the price of an asset avoid falling even further.
Fibonacci retracement levels are very important to understand how these support and resistance levels work. With this tool, we can definitely understand where to set our stop loss, our entry points and exit levels.
The Fibonacci retracement levels are 23.6%, 38.2%, 61.8% and 78.6%. At the same time, the 50% level is also used. When we measure the retracement from a local top, we can always see the 38.2% and 50% as the most plausible levels where the price could go. This can help us understand the movements of the price of a cryptocurrency and how we can leverage this data to make profits.
RSI
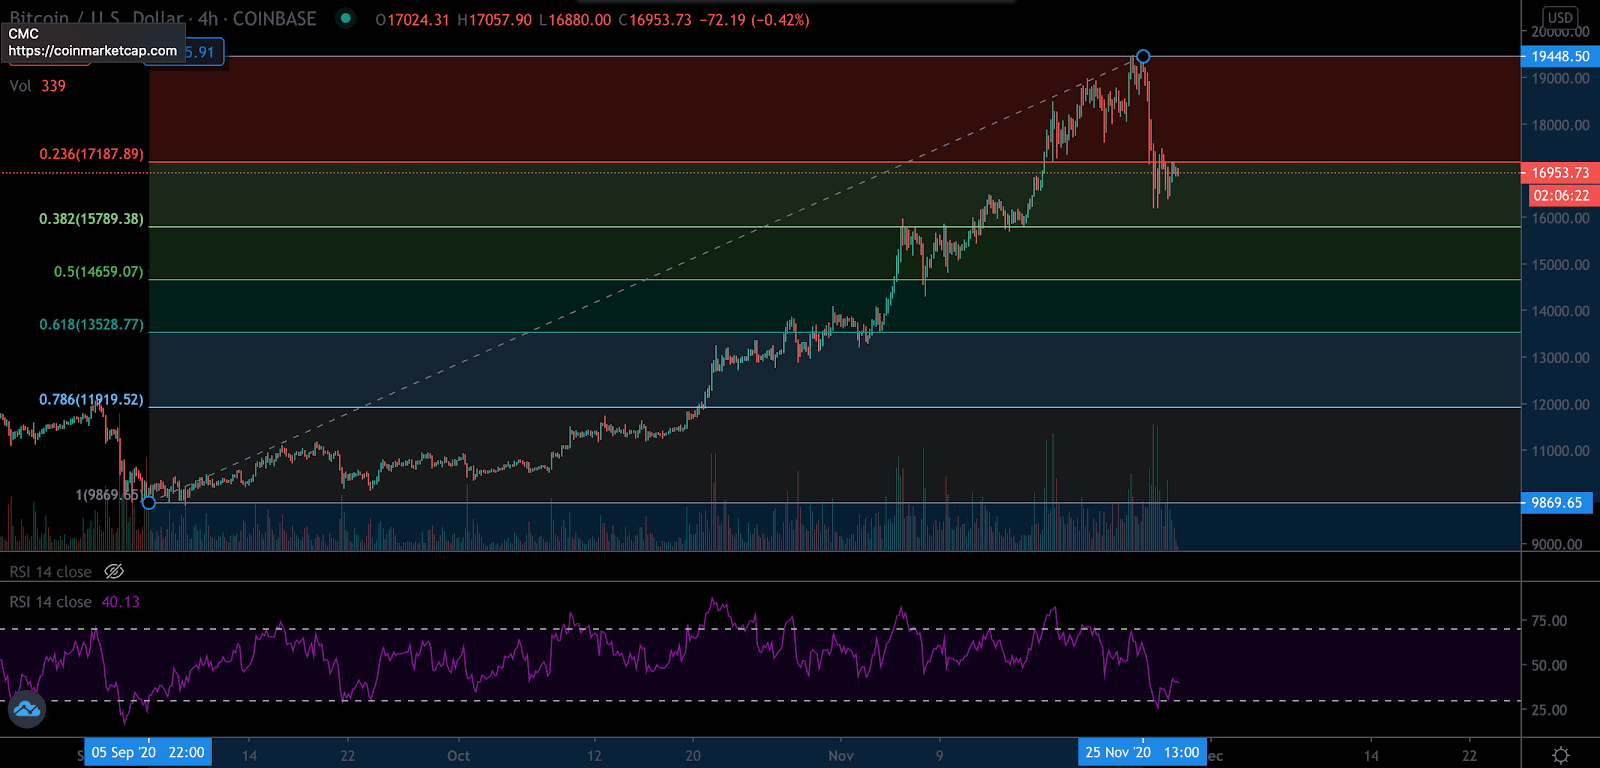
The RSI is also going to be a very useful tool to catch tops and bottoms. This can help us also understand whether a cryptocurrency is entering in bullish or bearish territory. This indicator is going to be added to the top or bottom of your chart and it will be among your favourites to trade digital assets.
The RSI helps us to measure the magnitude of a recent price change. At the same time, we will be able to understand if we are in an overbought or oversold condition. If an asset grows and moves higher over time, the RSI will show that it is in an overbought condition. If it falls massively, we will be in an oversold situation.
When the RSI is above 70, we can consider we are in an overbought condition. It is more likely to experience a retracement from these levels. Instead, if the RSI is below 30, then we should expect a local bottom.
In the next image, you can see the RSI with the Fibonacci retracement levels.
MACD
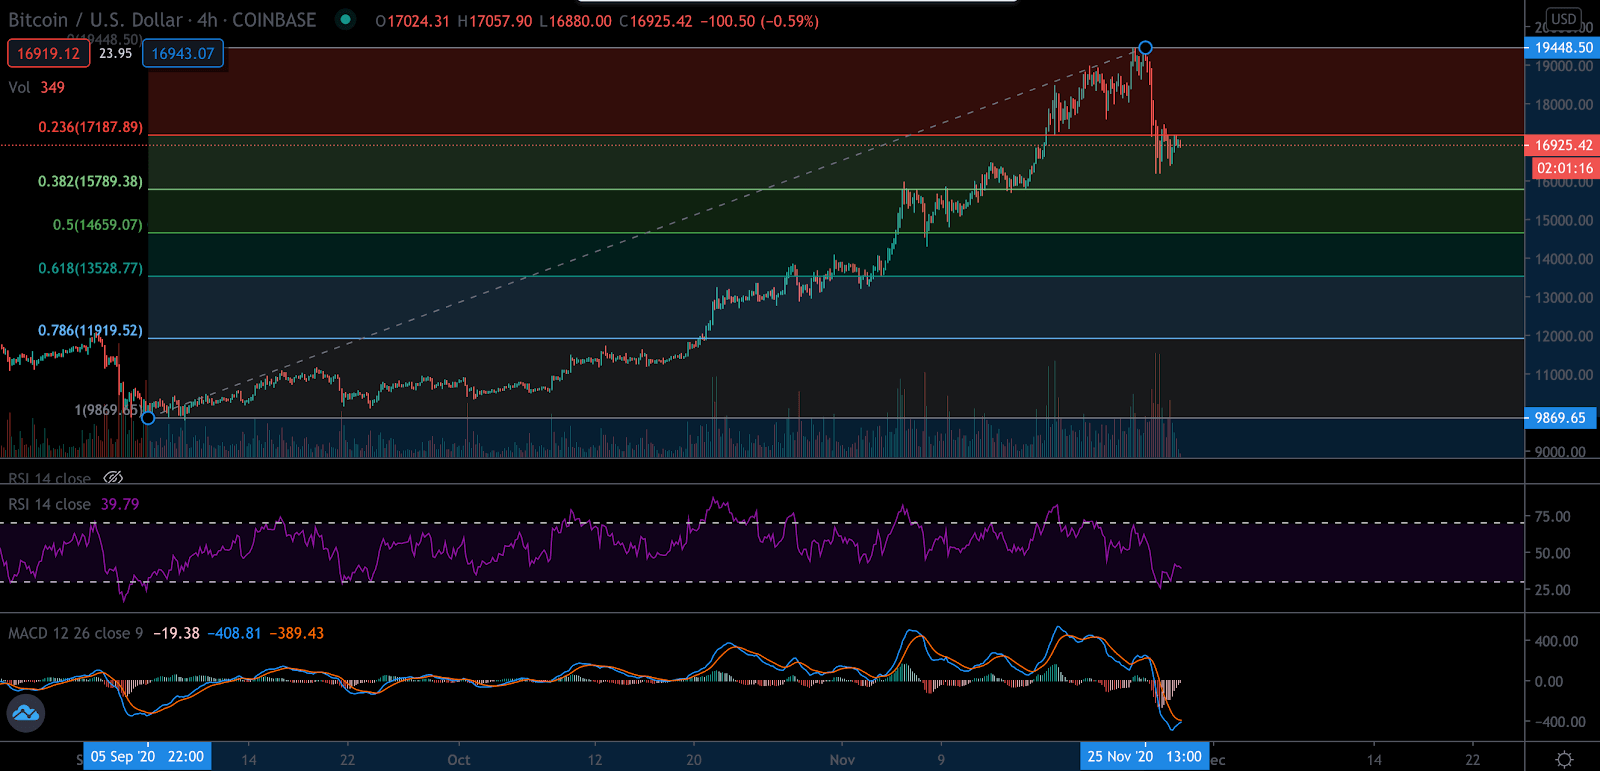
Let’s continue with other trading indicators for cryptocurrencies. The MACD is going to be a great tool to understand the trend of a digital currency. If you want to know whether an asset is going higher or downward, then this is going to be a very helpful tool.
The MACD is based on moving averages that would provide us with clear information of recent and also older price action for a specific period of time. Moreover, the MACD is also going to include histograms that will show us negative and positive changes in the market. (Whether the asset is going higher or lower).
As you can see in the image below, we have four indicators: volume, RSI, MACD and the Fibonacci retracement levels.
Trading Volume
Trading volume is also a very useful indicator. As you can see in the image above, volume plays an important role in showing and confirming whether the price is moving higher or lower. If the price of an asset moves higher (or lower) with low volume, this should be already a red flag. That means there is not enough volume to support this trend.
Instead, if the price moves higher (or lower) with high volume, we can see there is a lot of engagement in the market. This helps us understand that a price or movement is confirmed by market players.
These trading indicators for cryptocurrencies shown in this post should be used carefully and also implemented with other trading tools and indicator. In this way, they will provide more accurate information about the market and the price of an asset.


We are a large scale cryptocurrency community
providing you with access to some of the most exclusive, game changing cryptocurrency signals, newsletters, magazines, trading indicators, tools and more.
Your investments are your responsibility
We do not accept any liability for any loss or damage which is incurred from you acting or not acting as a result of reading any of our publications. You acknowledge that you use the information we provide at your own risk.
Altsignals does not offer investment advice and nothing in the calls we make should be construed as investment advice. Altsignals provides information and education based on our own trades. You are paying to follow our trades that we document for educational purposes.