The RSI indicator, also called the “Relative Strength Index”, is one of the most popular and widely used indicators in technical analysis. It is classified as relative strength because it allows us to measure how fast – how strongly – the price of a security rises or falls in relation to its usual prices for a given period.
This indicator fluctuates in a range from 0 to 100, signaling the level of bullish or bearish strength that prices show. Thus, when prices rise strongly the RSI also rises, and when prices fall the level of the RSI does too. Like most technical indicators, the main function of the RSI is to mark buy and sell signals so that we can know when to enter and exit the market.
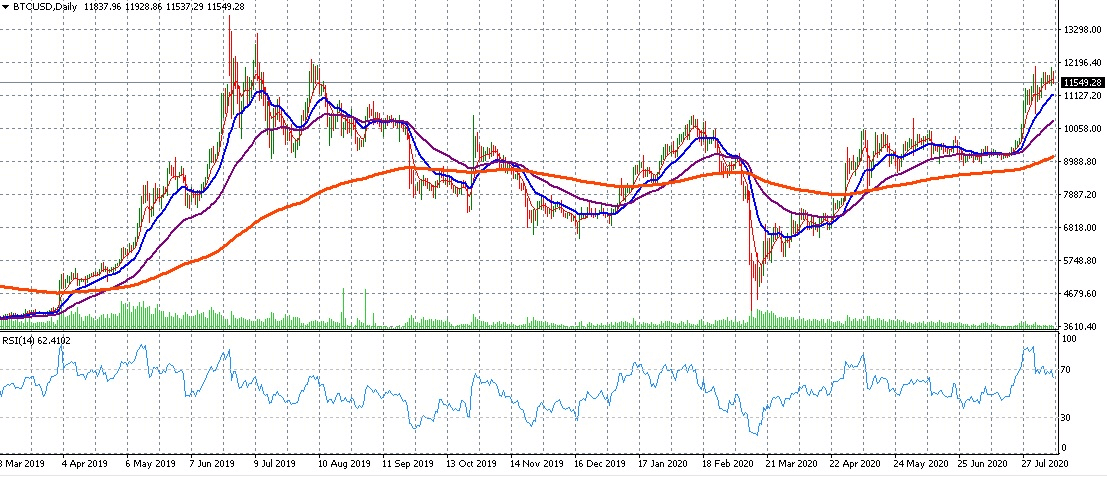
The RSI indicator signals can be read in various ways. For example, we can use the divergences of the oscillator with the price, look for “failures swings”, draw channels around the oscillator, and so on. However, the most common way to work with the RSI is to use the oscillator crosses with the overbought and oversold levels
Disclaimer: this guide shouldn’t be considered investment advice. All the information provided by AltSignals and its writers is not professional advice and was created for educational purposes only. Never invest more than what you are able to lose and always request help from a professional financial advisor.
Reversion trading strategy
One way to trade RSI is, for example, to use it in mean reversion systems. When we follow values we sometimes see that prices fluctuate around an average price. Sometimes assets or stocks trade above this price, then decline, rise again, and thus move in an almost horizontal range.
In these cases, we can use the RSI oscillator as a guide to know when we can enter the market. If we think that prices tend to revert to their mean, we will expect an exhaustion of the bullish movement when the RSI is overbought. Conversely, when the RSI marks oversold then we will wait for the price to stop falling and rebound.
Thus, the strategy of these trading systems is based on placing a long order when the RSI crosses the oversold level upwards and going short when the oscillator crosses the overbought level downwards. Due to the RSI setup, it is preferable to wait for the oscillator to exit the overbought or oversold zones to enter the trade, especially if an asset’s price continues to grow and the oscillator cannot go up any more since its maximum value is 100. Conversely in the case of declines. The oscillator is said to be saturated when the price continues its momentum, but the RSI can no longer follow its direction.
Calculating periods
One of the parameters that we can adjust is the RSI calculation period. The shorter the calculation period, the more sensitive the oscillator and the faster it reaches extreme levels. On the contrary, the longer the RSI calculation period, the lower the volatility of the oscillator.
In the example of graph 2 you can see the difference between a classic RSI of 14 periods RSI (14) and a RSI of 7 periods RSI (7), both applied to the same financial asset.
RSI Levels
The other possible adjustment concerns the levels. These levels can be the classic 70 for overbought and 30 for oversold or any other level that better suits our trading strategy. For example, if we raise the levels to 80 and 20 we will have fewer signals, but in theory with greater reliability per signal.
In addition, based on the RSI, you can create more personalized indicators such as the Stochastic RSI, or use the concept of the RSI to apply it to the AD Line.
The RSI can indicate good entry points, but if we use it to signal exits we run the risk of closing the operation prematurely. For this reason, to close the operation it is preferable to use a follow-up stop that allows us to make the most of the movement.


We are a large scale cryptocurrency community
providing you with access to some of the most exclusive, game changing cryptocurrency signals, newsletters, magazines, trading indicators, tools and more.
Your investments are your responsibility
We do not accept any liability for any loss or damage which is incurred from you acting or not acting as a result of reading any of our publications. You acknowledge that you use the information we provide at your own risk.
Altsignals does not offer investment advice and nothing in the calls we make should be construed as investment advice. Altsignals provides information and education based on our own trades. You are paying to follow our trades that we document for educational purposes.