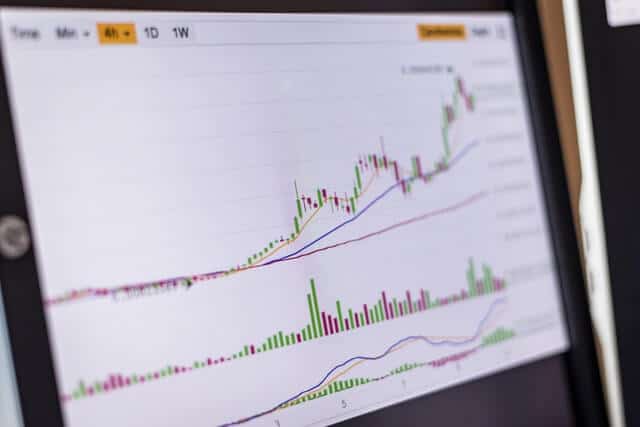
Cryptocurrency traders have been using a wide range of tools over the last years in order to perform technical analysis. Indeed, most of the crypto traders have been using the same tools used for technical analysis in traditional markets.
There are several crypto exchanges and trading services providers that have a wide range of tools ready for technical analysts to apply on their charts. Despite the fact that not all of us are technical traders, these tools will certainly be useful to understand market movements, entry and exit points and more.
In this article, we will share with you the top 10 cryptocurrency indicators to perform technical analysis. You will find some of these tools useful and of help when you will open the charts and start performing trading activities.
Disclaimer: All the information provided by AltSignals and its writers shouldn’t be taken as financial advice. The article has been created for educational purposes. Never invest more than what you are able to lose and only ask for advice to your personal financial advisor.
Indicator 1 – Elliot Waves
Elliot Waves are one of the most powerful tools to understand market movements over time. This is a method of technical analysis that takes into account traders sentiment and possible outcomes for specific trades. Combined with Fibonacci levels, this can be a very good tool for professionals to understand trend changes, entry and exit points.
The Elliot Waves follow market patterns that can be divided into 5 waves and 5 subsequent waves. You can see in the image below how the Elliot Waves work and how they can be understood.
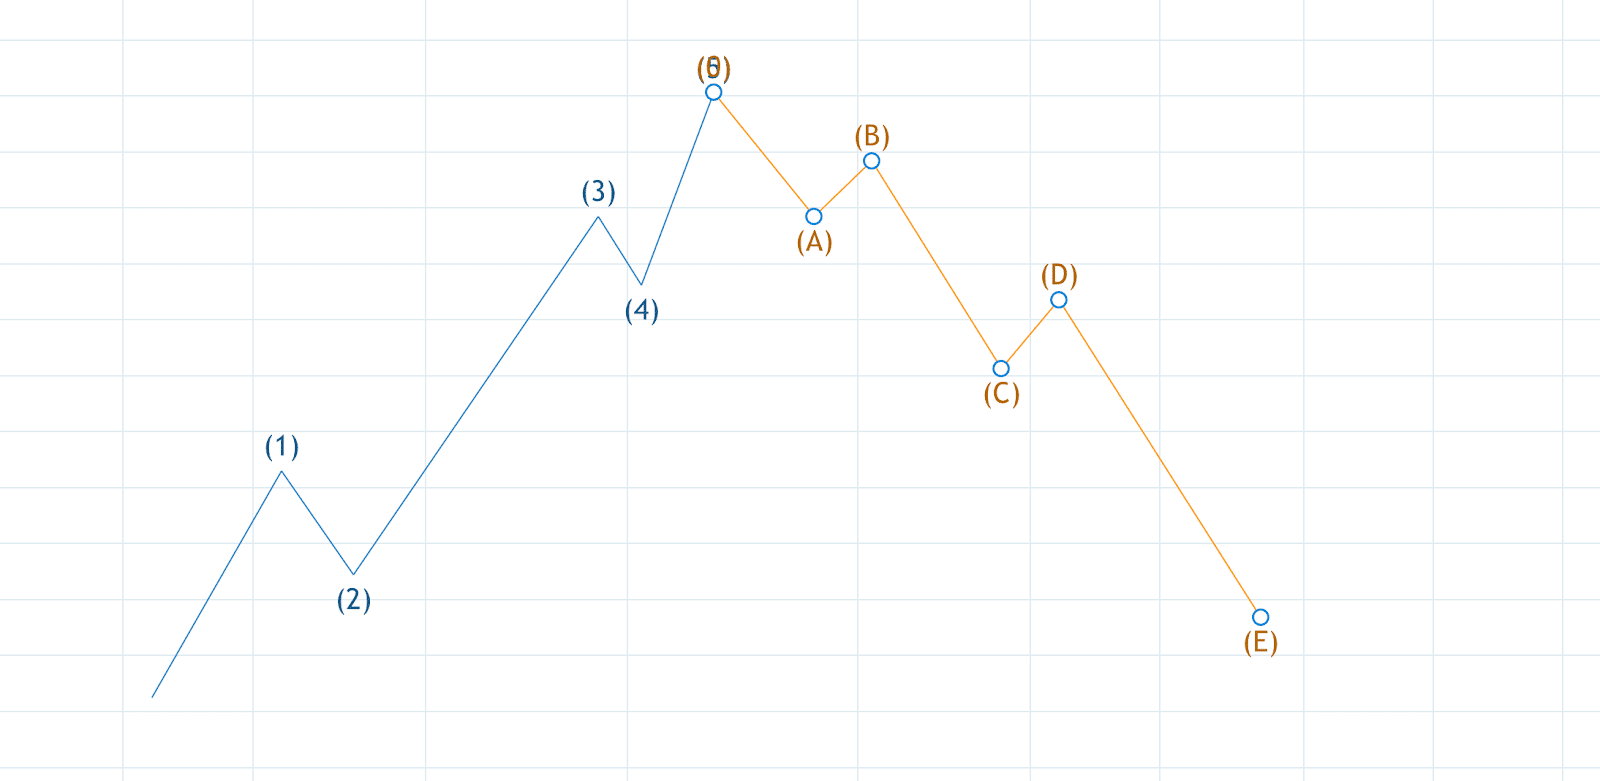
It is worth pointing out that this is just a representation and the Elliot Waves can move within different angles according to the different characteristics of the markets.
Indicator 2 – Fibonacci Retracement
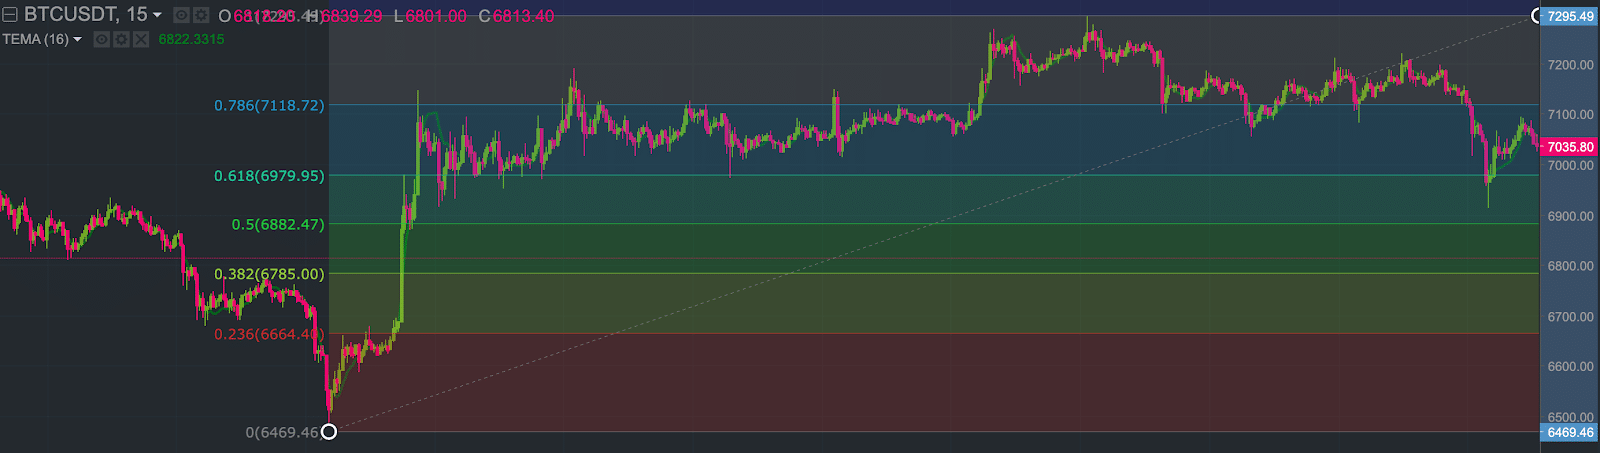
As abovementioned, the Fibonacci retracement is a great tool that can be used with Elliot Waves to recognize support and resistance levels. This is one of the most useful tools for traders in both crypto and traditional markets.
Traders can use the Fibonacci tool to understand how far the price of an asset can grow or how far it can fall after changing its trend. Furthermore, this can be useful to detect possible moments to enter the market or exit a trade.
The most important levels to take into account are the 0.382, the 0.5 and the 0.618.
Indicator 3 – Bollinger Bands
Bollinger Bands can be used by traders to understand the volatility of an asset and to understand the levels in which an asset is usually traded.
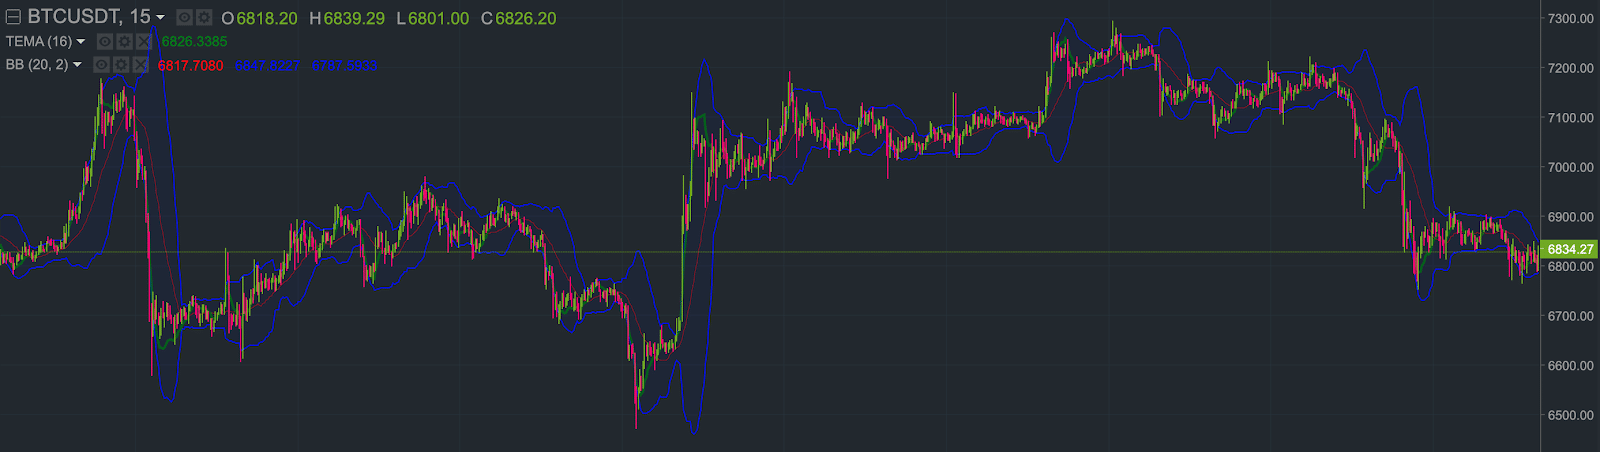
This provides information to traders about how volatile the market is and how the price of a specific cryptocurrency is behaving. In the image above, you can see the BTC/USDT in which there are periods of time with low volatility and others with higher volatility where the bands become wider.
This can also be used with other indicators to let us have a better idea about market movements, entry points and changes in the trend of an asset. Take into account that if the price of an asset is traded above the Bollinger bands this could mean the asset is overbought, if it trades outside these bands, it could be oversold.
Indicator 4 – Ichimoku Cloud
Ichimoku Clouds are great parameters to understand where levels of support and resistance are located. These levels can be identified in a fast and easy way. At the same time, this indicator can be used to indicate momentum and also show a trend direction.

When the price is above the cloud, the overall trend of the specific trading pair is up. The contrary thing will happen when the price is below the cloud. If we find a moment in which the price is operating in the cloud, this could mean that the market is not taking any specific direction and that there is no clear trend to follow.
Indicator 5 – Moving Average (MA)
As we have reported in a previous article, the moving average is perhaps one of the most popular indicators for traders that use cryptocurrencies and that are also trading in other markets. This indicator provides an average price for an asset during a defined period of time that can range between days to years.
Users could use daily or monthly MAs that can be used to understand the overall trend of the market and where it is expected to move.
It is worth taking into account that if the price of the asset you follow moves above or below the MA line, we could be changing the trend for a longer period of time. Although this is a basic tool, it is great to detect support and resistance levels as well.


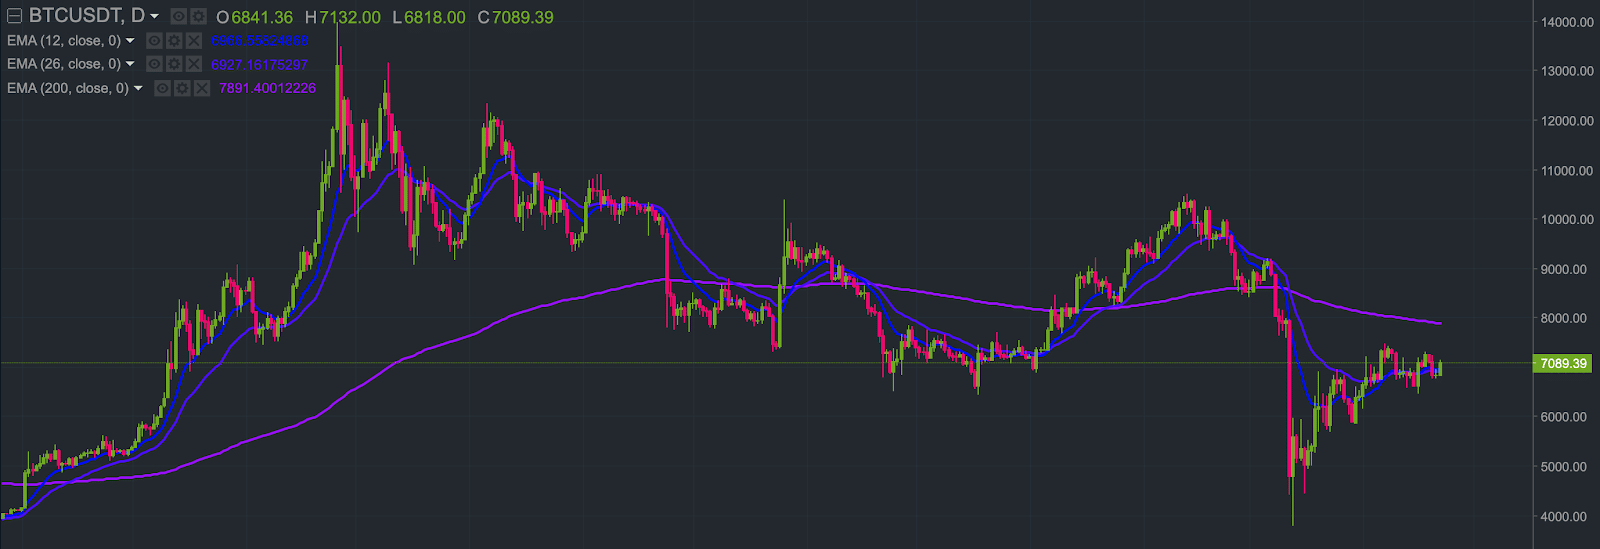
Indicator 6 – Exponential Moving Average
The Exponential Moving Average (EMA) provides similar information to the MA with the difference being the fact that it increases the weight of recent deviations in the market when displaying a trendline. This provides greater accuracy when trying to understand how the market behaves and why it behaves in such a way.
With the EMA users and traders will have the possibility to understand how the most recent data points can influence specific trends and price behaviours in the market. In addition to it, users would be able to understand where the price may encounter support and resistance levels.
The most popular EMAs used by traders include the 12 and 26-day EMA, which can be used for short and mid-term strategies in the cryptocurrency market. Meanwhile, traders using the 50 and 200-day EMAs are those that focus on long-term strategies.
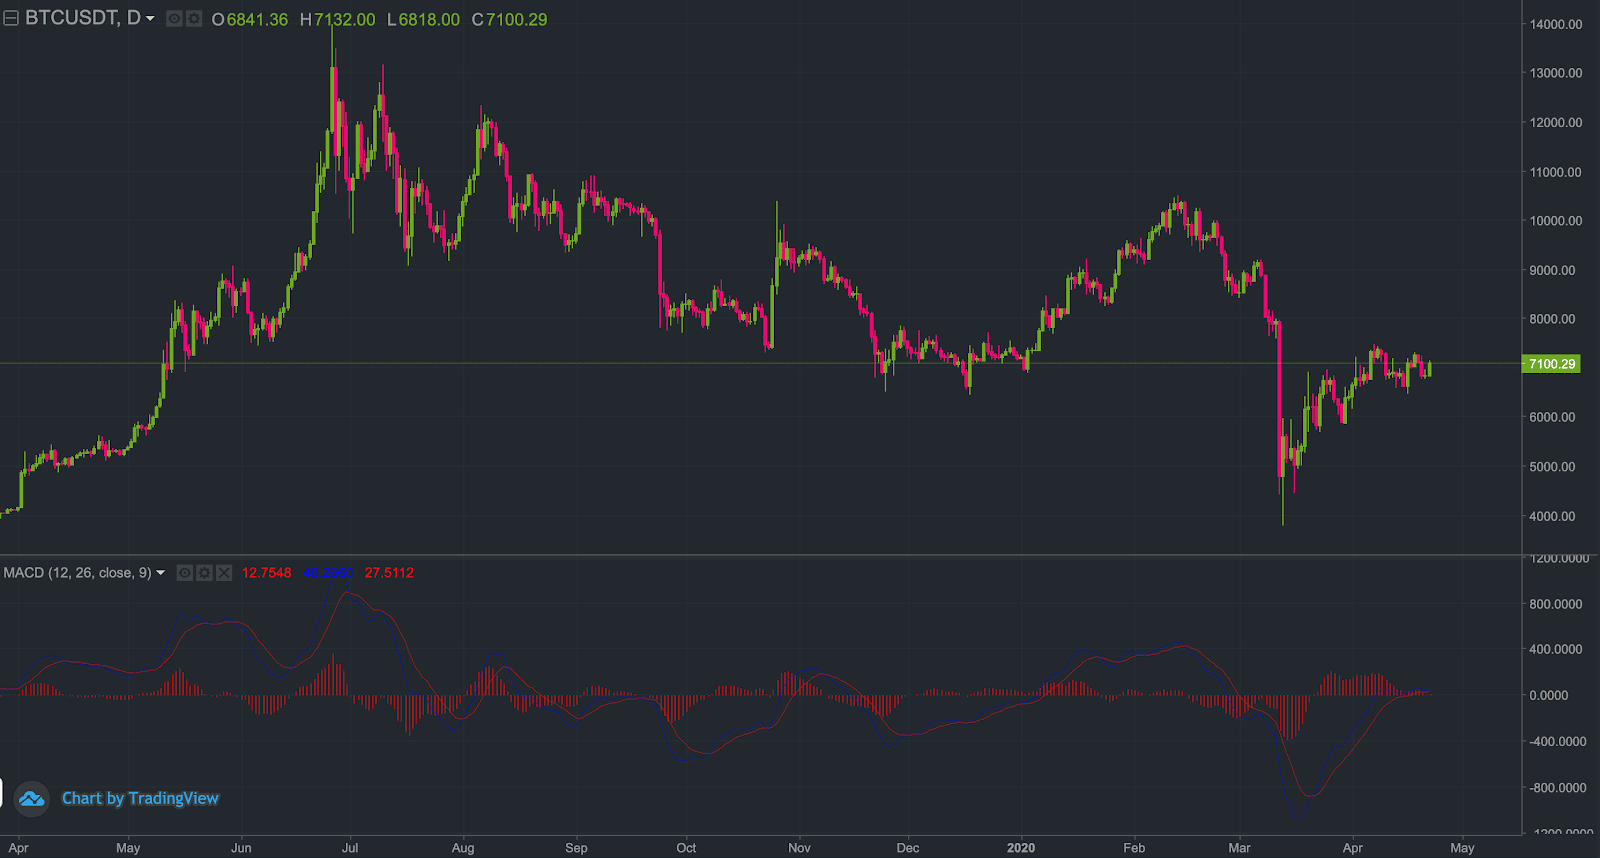
Indicator 7 – MACD
The MACD indicator stands for Moving Average Convergence Divergence and it can be used to better understand whether a trend in the cryptocurrency market is currently bullish or bearish. If traders understand which is the trend of a specific asset, it will then be possible to create trading strategies that would fit accordingly.
The MACD can be used when it changes its trend to enter or exit a position in a specific crypto market. Two of the most popular trading pairs in the crypto space include BTC/USDT and ETH/USDT, among others.
This indicator stands below the main chart you are using, which allows you to easily combine this indicator with others. This is certainly useful to confirm exit and entry points with several technical indicators rather than just one.
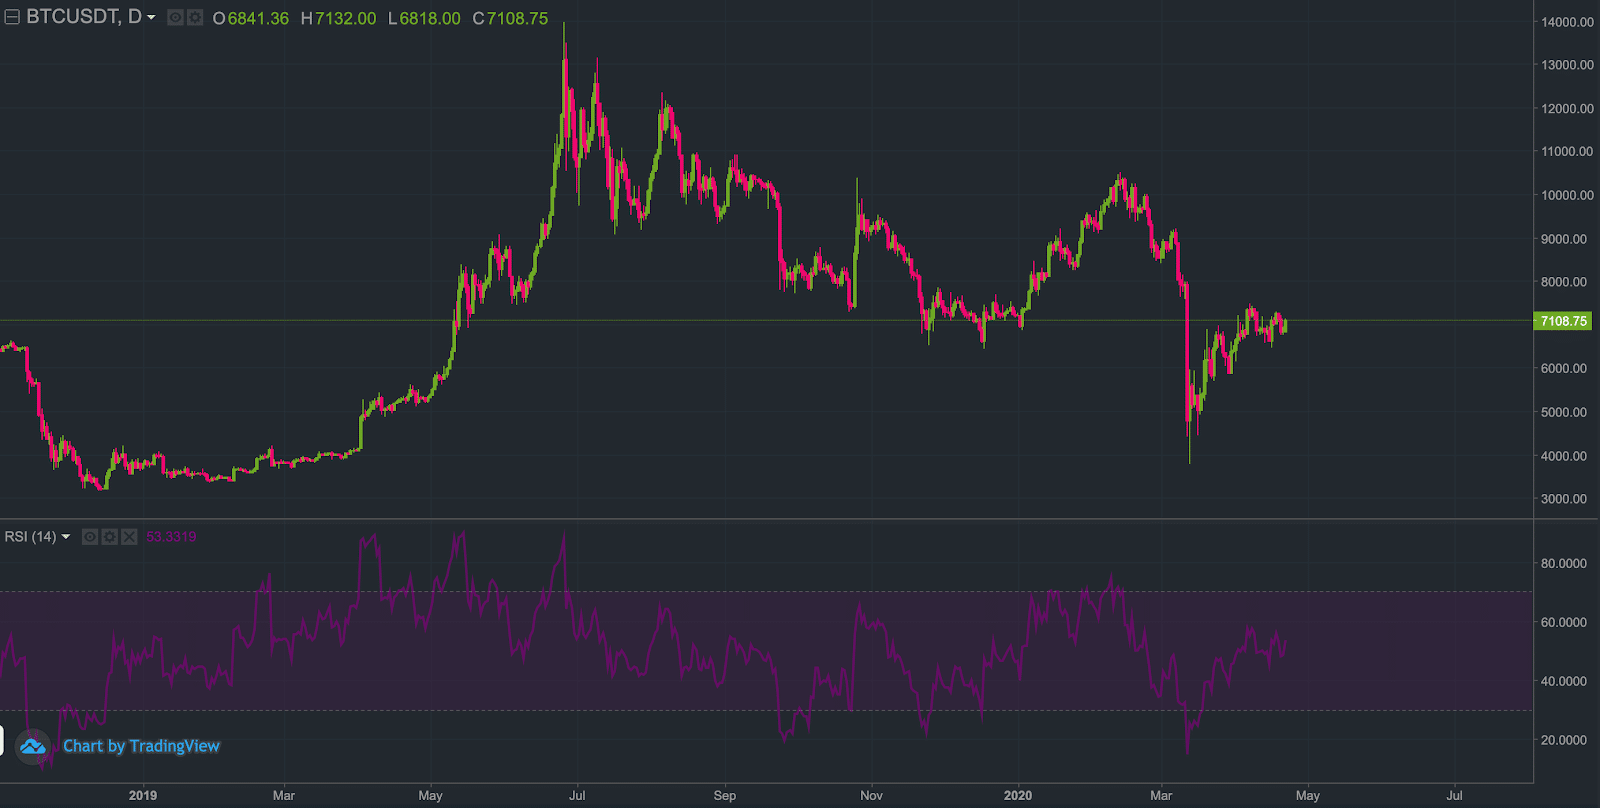
Indicator 8 – Relative Strength Index
This indicator, known as RSI, is used by traders and users to understand when the market is building momentum in a specific trading pair. The Relative Strength Index operates within a range of 0 and 100 where there are three main ranges of prices.
The top range goes between 70 and 100 and it shows the price of an asset is entering oversold territory. The middle range goes between 30 and 70 and it indicates an asset is traded without specific bullish or bearish bias. The lower range goes between 0 and 30 and it indicates a cryptocurrency price is entering oversold territory.
This can be used to understand and confirm which are good moments to buy and sell a cryptocurrency. If it is in oversold territory, it could be a good moment to enter considering bears could be running out of steam. The contrary would happen if the price is in overbought condition.
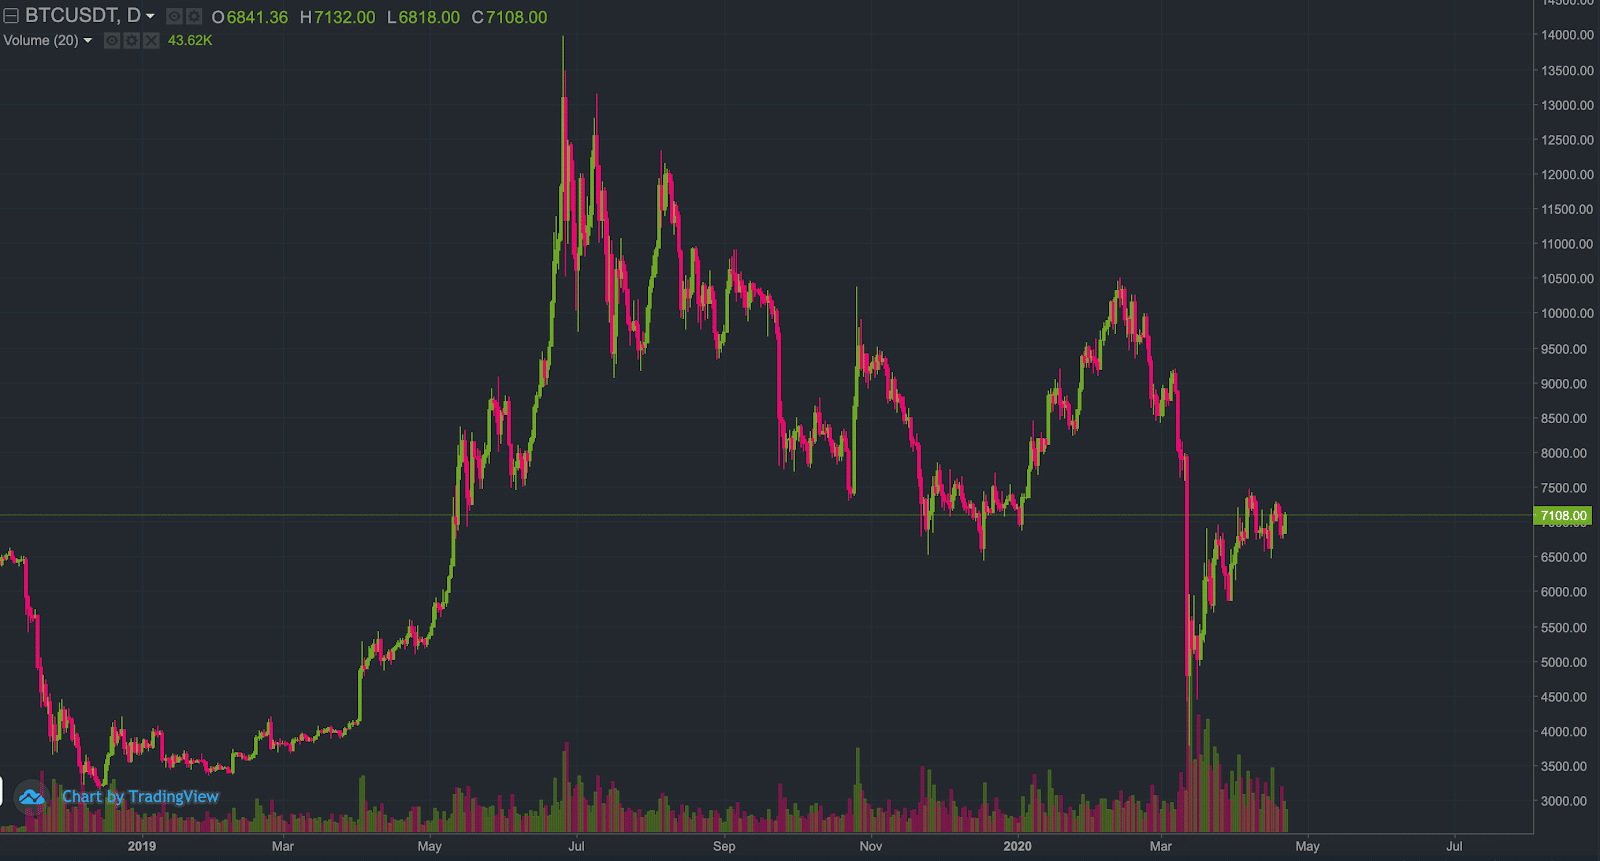
Indicator 9 – Volume
Volume is part of the starter pack of every trader in the market. This can be clearly used to confirm that a trend is changing or that traders are confirming a specific price. At the same time, the volume can provide valuable information about how strong a move is.
If the price of a cryptocurrency starts moving higher, then we can be sure that the trend could continue if we have high volume backing it. If instead, there is a low volume during an uptrend, then we should also consider that the trend could soon change direction and fall rather than continuing its upward trend.
This shows that there is exhaustion in traders that are buying the asset at these prices. The contrary would occur if the price of an asset is falling.
Indicator 10 – Parabolic Stop and Reverse (SAR)
The Parabolic Stop and Reverse (SAR) trading pattern shows the specific trend of a cryptocurrency. The dots show which is the possible direction in which the price of a cryptocurrency is moving. This makes things much easier for traders that want to understand where the trend is going.
When the dots fall below the price of the asset, this indicates that the market is going in an upward trend. If they go above the price, the market is in a downtrend. When the dots change position, this could be a good indicator where we should be entering or exiting a position.

Final Thoughts
Mastering the top cryptocurrency indicators can significantly improve your ability to read market movements and make smarter trading decisions. Whether you’re using momentum tools like RSI, trend-following indicators like moving averages, or volatility measures like Bollinger Bands, each one offers unique insights when applied correctly.
However, theory alone isn’t enough — seeing how these indicators are used in real-time adds a crucial layer of understanding. That’s why we recommend visiting our Crypto Technical Analysis page, where our expert analysts apply these tools live to ongoing market conditions. It’s the perfect way to bridge the gap between technical knowledge and trading execution.
By combining continuous learning with real-world application, you’ll be better positioned to navigate the fast-paced world of crypto trading with clarity and confidence.