As new investors and traders realize the positive things of trading stocks and cryptocurrencies, many of them are wondering which are 5 trading indicators for cryptocurrencies and stocks that they could start using. Although there are several indicators, we had made a list of the ones we consider can be useful for beginners to learn how to trade digital assets and stocks.
Disclaimer: the information provided in this post should not be considered investment advice. The content should be for educational purposes only. Never invest more than what you are able to lose and always request information from an accredited and professional financial advisor.
Bollinger Bands
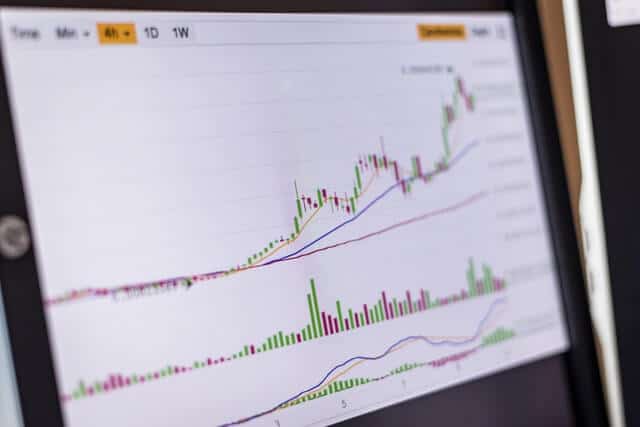
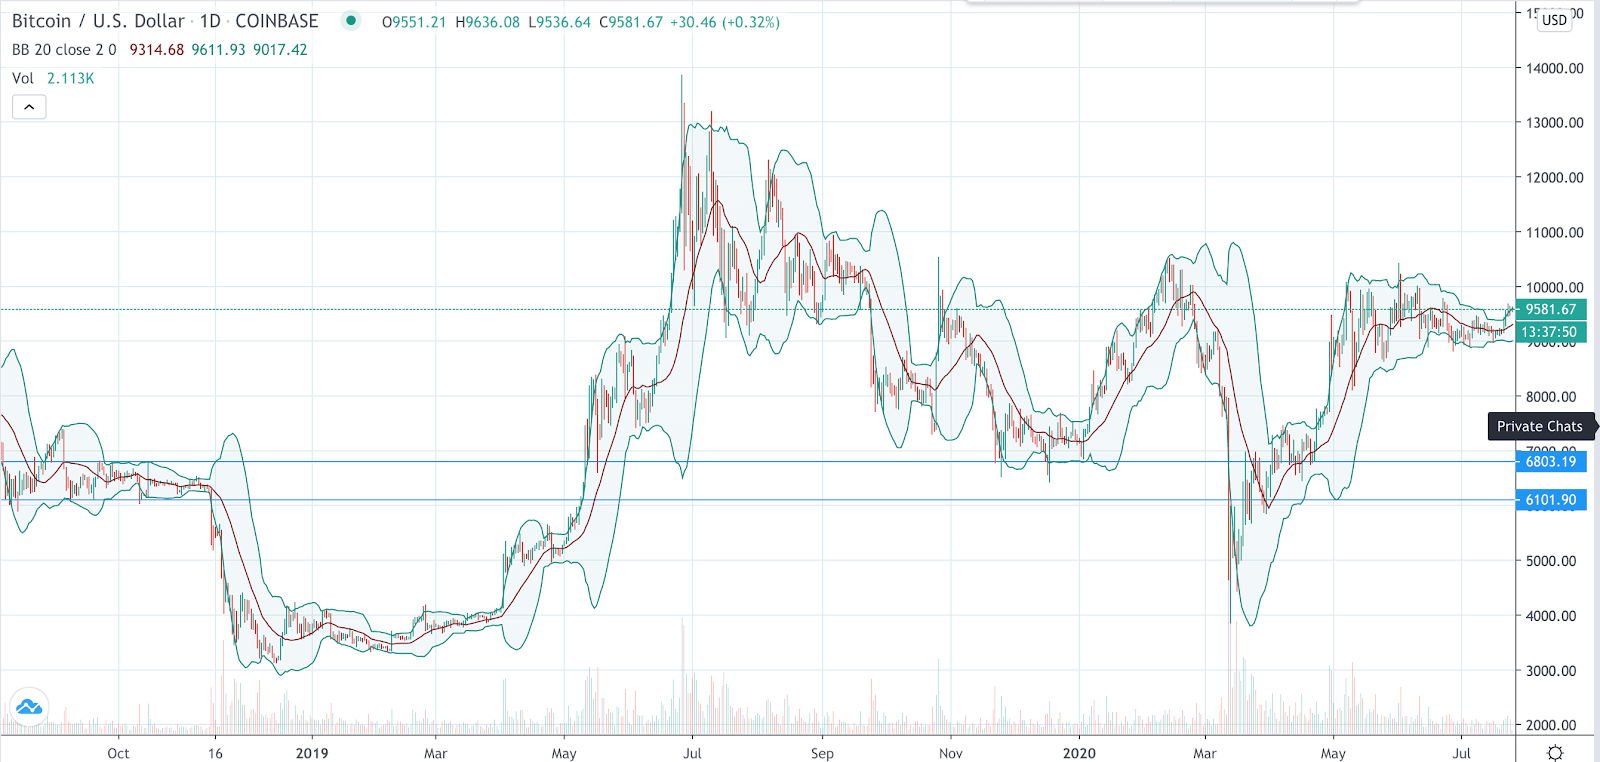
Bollinger Bands are one of the most useful trading indicators for cryptocurrencies and stocks that you can start using. This trading indicator can provide great information about the strength of the market and the way in which the market is moving.
This is considered to be an indicator that measures the strength of a specific trend. When the market grows or falls, the price will be close to the outer bands you can see in the image. This shows the market is moving in a strong way and it could continue to do so.
However, when we see the price moves away from the outer bands and it starts getting closer to the centre, this could be an indicator of the trend stopping. Thus, you will want to closely follow the Bollinger Bands and how they can affect the way in which you trade.
Bollinger bands could be useful to understand when to enter or exit the market.
MACD
The MACD – also known as Moving Average Convergence Divergence – is one of the most popular trading indicators for cryptocurrencies and stocks that users can definitely start following. This would certainly be useful in order for individuals to understand whether the market is changing trend or if we are in a good moment to exit or enter a trade.
In addition to it, the MACD can help us to understand which are the support and resistance levels in a chart. Compared to the Bollinger Bands that they are on top of the price, the MACD is going to be an additional chart below the price chart displayed. This is going to make it easier to understand and to follow.

Fibonacci Levels
Although this can be considered a tool rather than a traditional indicator, we are sure that this can be very useful to trade both cryptocurrencies and stocks. The Fibonacci levels come from the Fib sequence and can be very helpful to understand which are the support and resistance levels for a specific period of time.


It can help us get the retracement levels to which a cryptocurrency or stock price could move and it can be very useful to understand the extension prices to which the prices of digital assets could arrive. This tool can also be combined with other indicators in order to have better information about what the price can do and how it could move.

This tool can also be used with multiple time frames and in a wide range of assets.
Relative Strength Index (RSI)
The relative strength index (RSI) is also a great tool to understand whether a digital currency or stock is in an oversold or overbought condition. The RSI can be used to understand momentum in the markets considering it will be sharing with you whether an asset could already stop growing or falling.
The RSI offers a clear indication with values that range between 0 and 100 and that are subdivided into three smaller ranges. Between 0 and 30; 30 and 70; and 70 and 100. When the RSI is above 70, we could say the price of the asset is in an overbought condition. If on the contrary, the RSI shows a value between 0 and 30 we could suppose the asset is in an oversold situation.
However, if the RSI is between these two levels, then we could say the asset is stable.

Moving Averages
Moving Averages can also be very useful indicators to trade stocks and cryptocurrencies. The Moving Average provides users with information about the average price that a stock or cryptocurrency had during a specific period of time.
Users can select between monthly, daily or hourly moving averages according to their needs. This would also provide them with more accurate information about the price they are analysing. If the price of an asset moves above the MA, then we could think that there is bullish sentiment in the space. If the contrary happens, then we could see the asset falling rather than growing.